A central source of truth for all your investments
ICD Portfolio Analytics leverages AI technology to alleviate the time-consuming process of aggregating and harmonizing disparate portfolio holdings data for timely analysis and reporting.
Aggregate all Investment Positions to See Your Real Exposure
ICD Portfolio Analytics doesn’t just aggregate data. It standardizes it and then presents it through a series of highly configurable dashboards that enable treasury teams to easily view, analyze and make decisions on demand. You can explore each of the solution’s unique tiers of functionality in more detail below.
Portfolio Positions Analysis
Customize the metrics you want to track. Analyze each metric at the summary level or use drill-down tools for granular views
Compliance Limit Analysis
Create a limitless number of investment compliance rules and seamlessly apply them across each facet of your portfolio
Portfolio Risk Monitoring
Monitor your risk in multiple dimensions and drill down to uncover actionable insights
Process
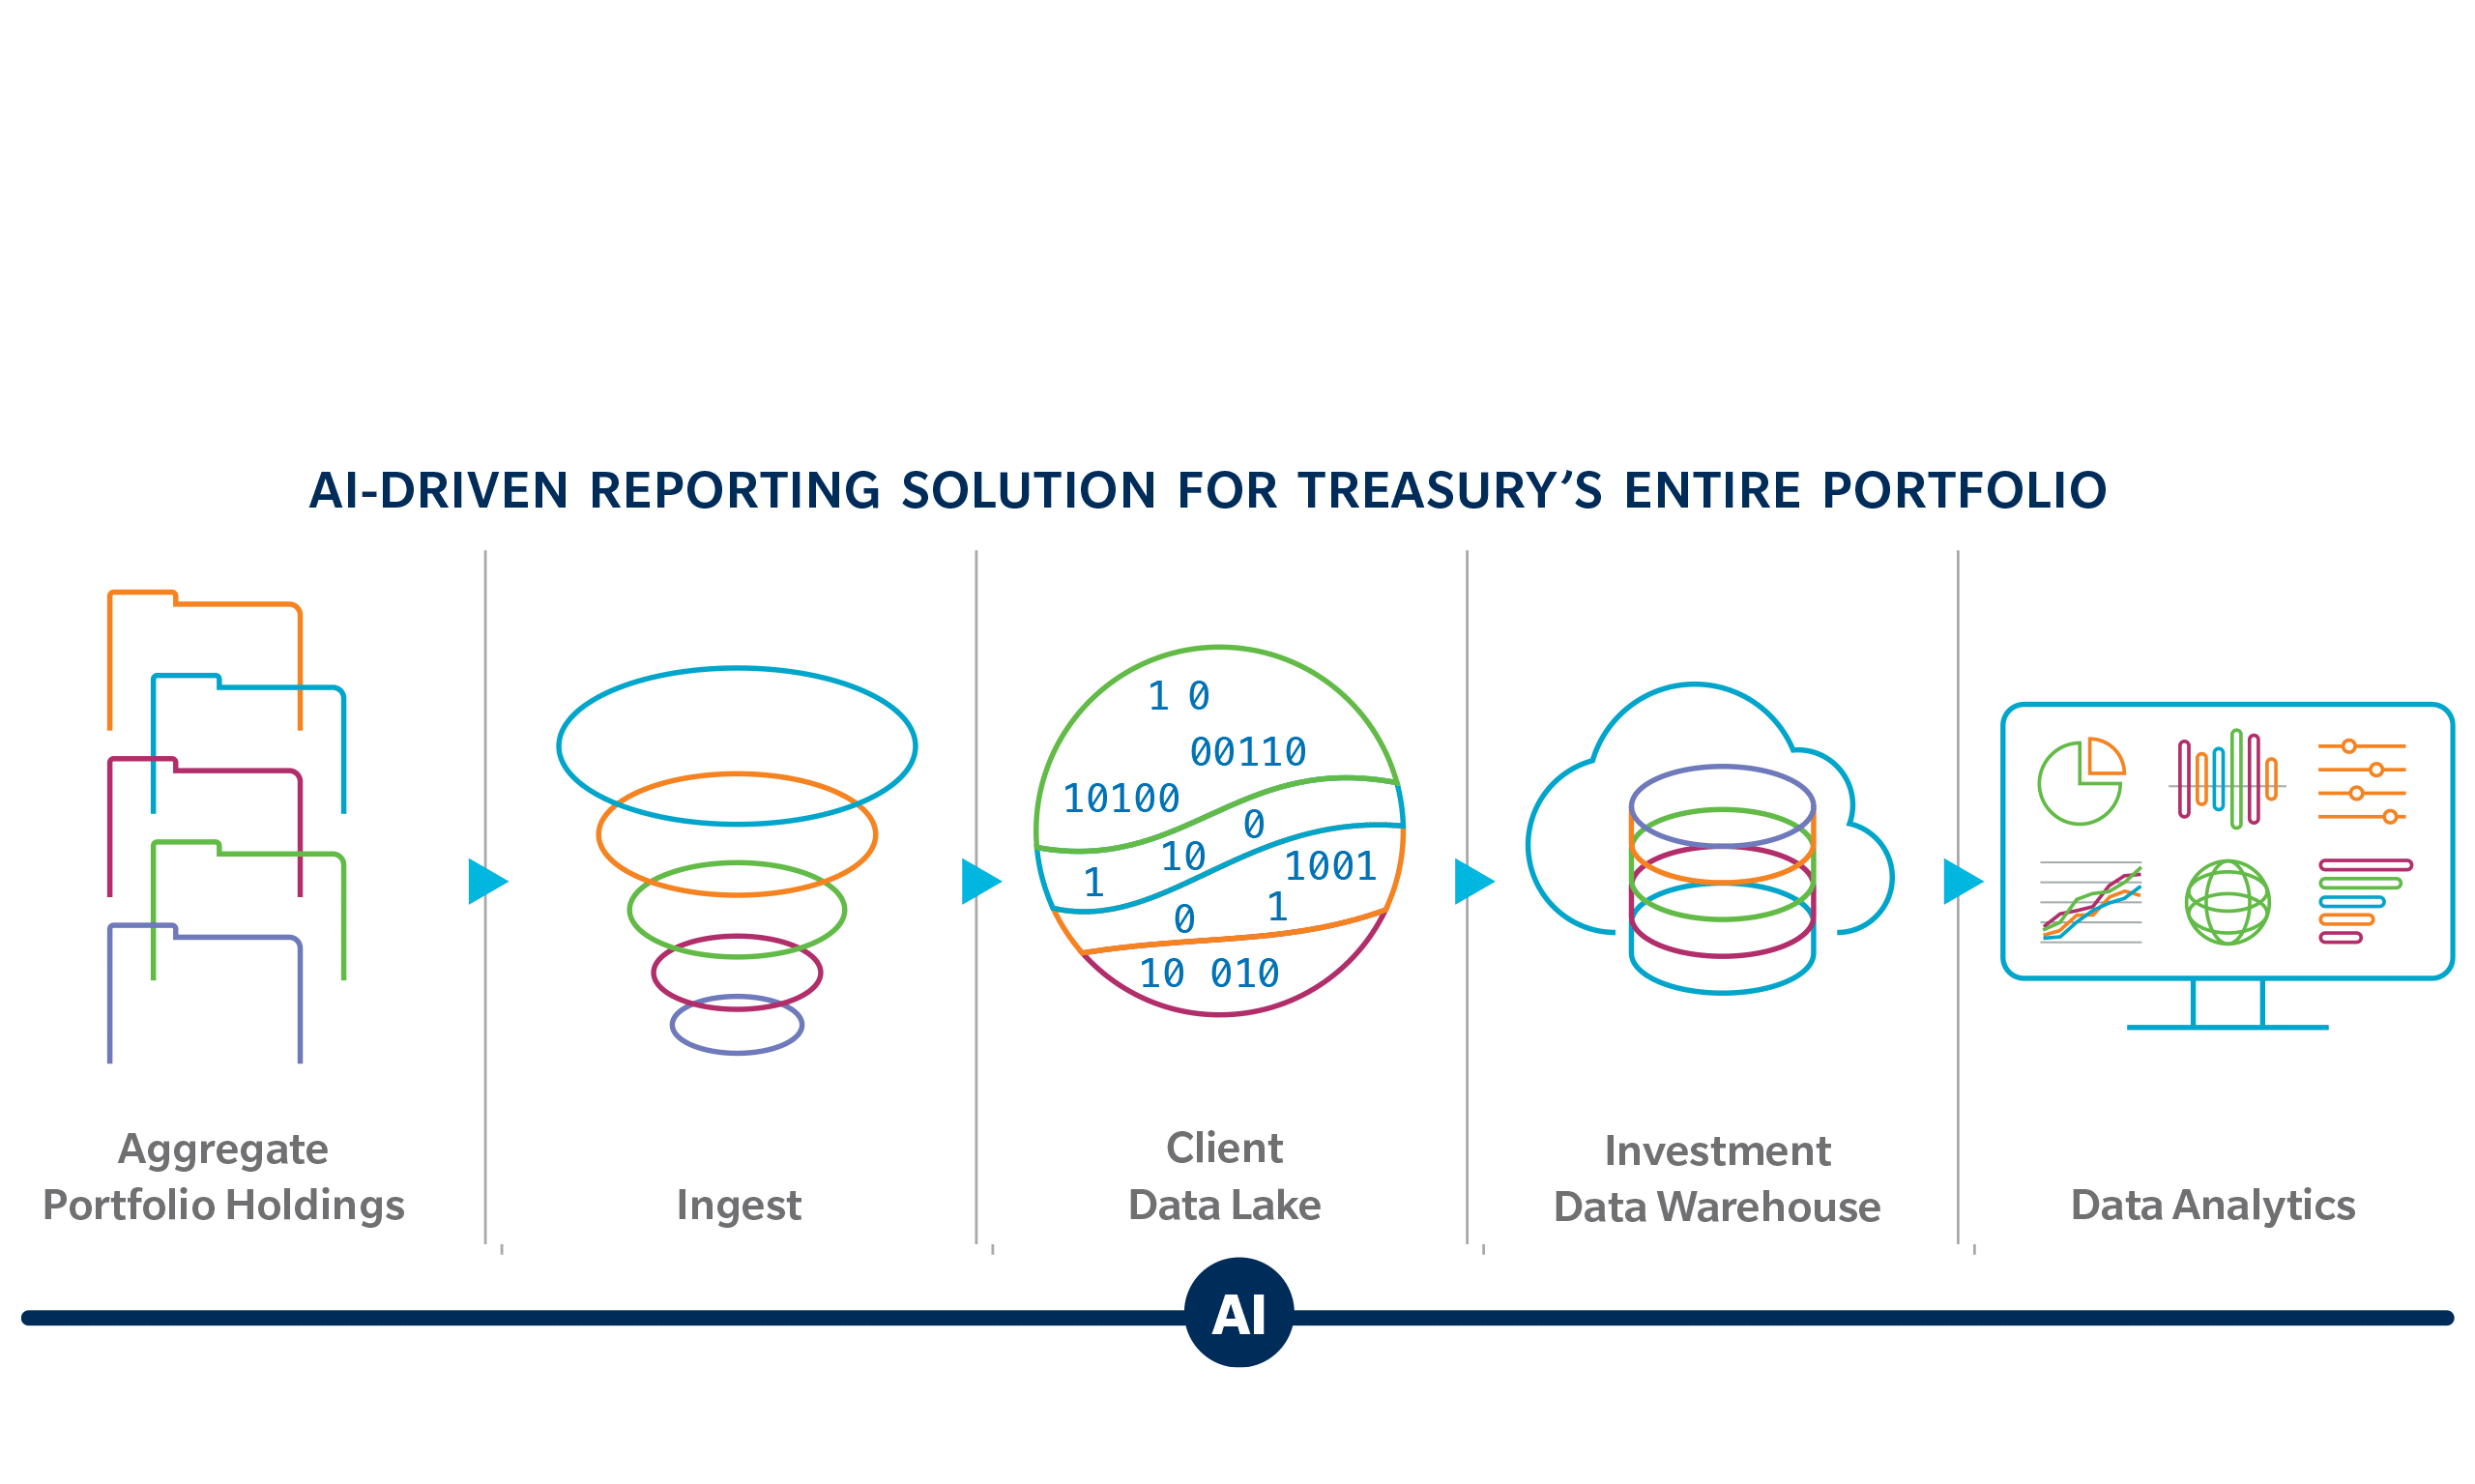
Save Time with AI-driven Data Processing
Investment data often resides in multiple systems and sources. We aggregate and standardize data from all these sources including custodians, asset managers, ERPs, TMSs, banks and more to create a single source of truth for reporting.
Dashboards
Gain Unparalleled Visibility with ICD Portfolio Analytics Dashboards
Customize multiple views of all your investment data for seamless analysis and reporting. Easily visualize portfolio composition and compliance with the ability to see data in aggregate, or drill down for granular analysis and print or export information in seconds. Securely review investments, exposures, and policy guidelines from your mobile dashboard.
ICD Portfolio Analytics incorporates our underlying fund holdings with other investment positions, making it possible to see our true exposures across all of our investments. This is invaluable given the heightened focus on exposures due to the 2023 bank failures.”
Bill Lundeen
Indivior